Recently, retired North Carolina Supreme Court justice and 2022 redistricting special master Bob Orr filed a lawsuit challenging the redrawn congressional and state legislative maps based on “fairness.” My colleague Dr. Andy Jackson explained how the plaintiffs’ central claim in this lawsuit is just another partisan gerrymandering claim presented under a new name. The case will likely rehash the familiar arguments the court heard in the recent partisan gerrymandering case, Harper v. Hall.
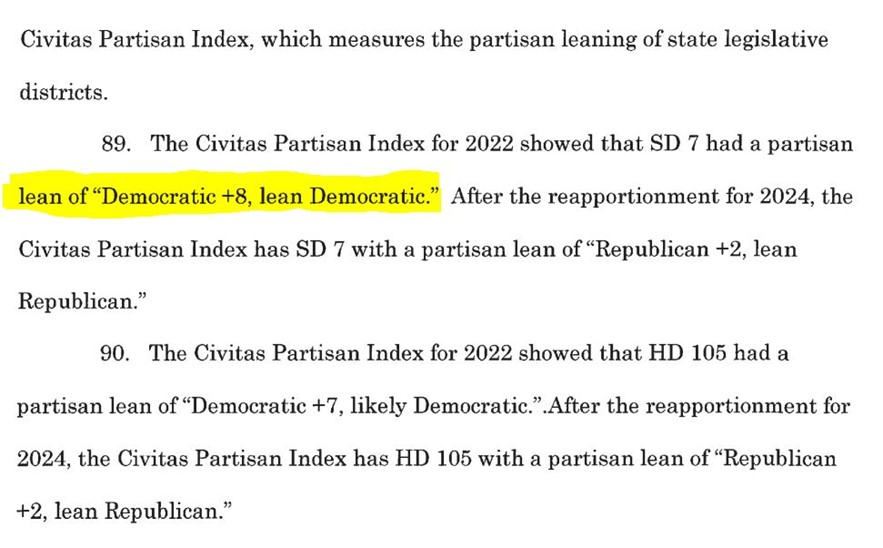
What caught my eye about this lawsuit, however, was the plaintiffs’ evidence against the state House and Senate districts. Instead of hiring their own redistricting experts to analyze districts, plaintiffs used our work — namely, the Civitas Partisan Index (CPI) — as evidence against the new Senate District 7 (SD 7) and House District 105 (HD 105).
The CPI is a tool published by the John Locke Foundation to evaluate the partisan lean of North Carolina General Assembly districts. The CPI was highly reliable in reflecting voter behavior in over 94% of races in 2020 and 2022. Nevertheless, the plaintiffs misused the CPI in three ways.
1. Misstating the CPI rating for SD 7
The most obvious error is misreporting the CPI’s 2022 rating for SD 7. As part of the lawsuit’s factual allegations, the plaintiffs claimed the 2022 CPI rating of the district was a D+8, which they called a “lean Democratic” seat. In reality, SD 7 was rated a D+0 in the 2022 CPI, which means it was considered a toss-up seat. See below:

Not only did the plaintiffs’ claims misstate the district’s rating, but they didn’t even match the scaling system utilized in the CPI. A D+8 district would be considered a likely Democratic seat, not a lean Democratic seat.
2. Ignoring that HD 105 in 2024 has very little overlap with HD 105 in 2022
While plaintiffs accurately quoted the 2022 and 2024 CPI ratings for HD 105, comparing the 2022 and 2024 ratings for the districts that share that name would be misleading. The 2024 version of HD 105 shares only two precincts with its prior iteration. In terms of population, the new HD 105 contains only 11.3% of the people who lived in the HD 105 of 2022.
The current HD 105 pulls most of its population from the 2022 version of HD 103, which the CPI rated a D+2 that year. Comparing these districts simply because they share the same name would lead to an inaccurate depiction of the effect that redistricting had on a district. Suppose a district was left unmodified between maps but given a different name. You would not then compare it with a prior district that shared that name but not the geography.
3. Failing to account for the year-to-year changes in the CPI
Aside from the specific issues with the House and Senate districts cited in the lawsuit, the plaintiffs failed to account for how we at the John Locke Foundation calculate the CPI. The CPI describes the partisan leaning of a district in comparison with the average partisan leaning of the state. Consequently, it is not a static scale from year to year.
The CPI is adjusted after every election. In the 2024 iteration, we updated the CPI by including the most recent statewide judicial elections. For that reason, the CPI had three variables modified from its 2022 iteration:
- The average partisan leaning of the state, which changed from 50.76% to 51.36% favoring Republicans
- The total number of votes from all elections used in the CPI
- The geographic changes in the districts from redrawing the maps
Plaintiffs did not account for the first two variables, focusing solely on the geographic changes from legislators redrawing districts. By ignoring those other variables, however, their use of the CPI creates an apples-to-oranges comparison.
Here is an example showing the importance of statewide partisan lean and total number of votes for a district that wasn’t changed geographically. In both iterations of the legislative House maps, HD 22 consisted of Sampson and Bladen counties in their entirety. The district was rated an R+7 in 2022, but it had become an R+8 in 2024.
The plaintiffs’ failure to account for all these changes paints an inaccurate picture of how much districts have been altered from redrawing of districts.
While the CPI is an excellent tool for understanding a district’s political standing, using it to compare districts from year to year doesn’t work. There are more variables in play than simply the shift in district lines.